About JASPAR TFBS sets enrichment
The JASPAR enrichment tool predicts which sets of TFBSs from the JASPAR database are enriched in a set of given genomic regions. Enrichment computations are performed using the LOLA tool. For more information about the underlying enrichment computations, read the LOLA documentation.
The tool allows for two types of computations:
- Enrichment of TFBSs in a set of genomic regions compared to a given universe of genomic regions.
- Differential TFBS enrichment when comparing one set of genomic regions (S1) to another (S2).
1. Enrichment within a given universe of genomic regions
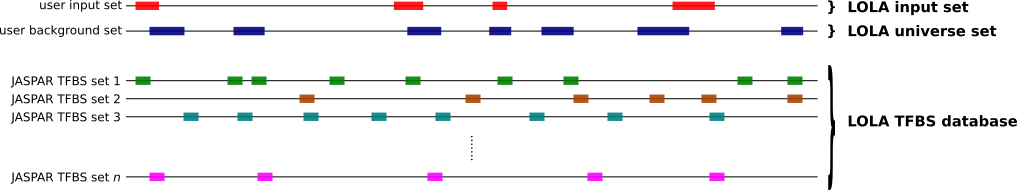
To compute which sets of TFBSs from JASPAR are enriched in a set S of genomic regions compared to a universe U of genomic regions, you can use the oneSetBg subcommand as follows.
bin/JASPAR_enrich.sh oneSetBg <loladb_dir> <S bed> <U bed> <output dir> <API_URL> <n_cores>
Here:
loladb_diris the directory containing all the LOLA database batches for an organism and assemblyAPI_URLis the URL to the matrix API in JASPAR, such asjaspar2020.genereg.net/api/v1/matrix/n_coresis the number of processor cores to use when performing the computation
This will compute the enrichment of TFBS sets from JASPAR in the
genomic regions from S (provided as a BED file) when compared
to the expectation from a universe U of genomic regions
(provided as a BED file). All result files will be provided in the
<output
        dir>
directory.
Note that every region in S should overlap with one region in U.
2. Differential enrichment
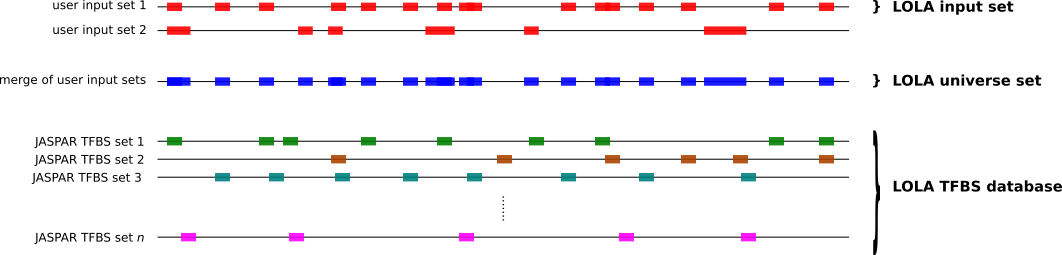
To compute which sets of TFBSs from JASPAR are enriched in a set S1 of genomic regions compared to another set S2 of genomic regions, you can use the twoSets subcommand as follows.
bash bin/JASPAR_enrich.sh twoSets <loladb_dir> <S1 bed> <S2 bed> <output dir> <API_URL> <n_cores>
Here:
loladb_diris the directory containing all the LOLA database batches for an organism and assemblyAPI_URLis the URL to the matrix API in JASPAR, such asjaspar2020.genereg.net/api/v1/matrix/n_coresis the number of processor cores to use when performing the computation
This will compute the enrichment of TFBS sets from JASPAR in the
genomic regions from S1 (provided as a BED file) when
compared to the genomic regions in S2 (provided as a BED
file). All result files will be provided in the <output
dir> directory.
JASPAR enrichment output and example
Output
The output directory will contain the allEnrichments.tsv file provide the enrichment score for each TFBS set from JASPAR along with their metadata information. Similar files (following the template col_<TF>.tsv) are created for each TF with all data sets available for that TF.
A visual representation of the enrichment analysis is provided in the output directory with three plots:
- A swarm plot using the log10(p-value) of the enrichment for each TFBS set on the y-axis.
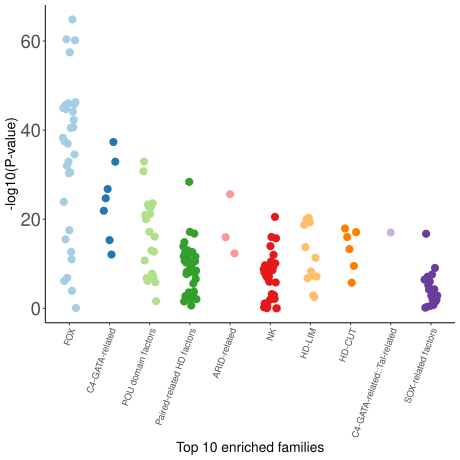
- An interactive beeswarm plot showing the 10 most enriched TFs.
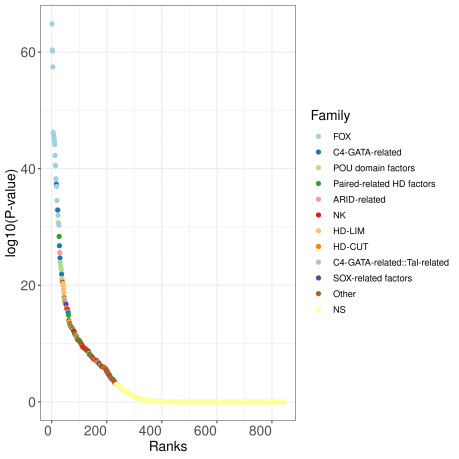
- An interactive ranking plot showing the log10(p-value) for all the datasets in JASPAR.
In the three plots, the data sets for the top 10 TFs showing log10(p-value) < 3 are highlighted with dedicated colors (one colour per TF). Data sets with log10(p-value) > 3 are provided with a colour for N.S. (non-significant).
Users can explore the results with the interactive plots. These plots permit the hiding and showing of the top 10 enriched TF families, and the tooltip displays the TF name, matrix ID, -log10(p-value) (also known as significance), family and class annotations.
Example
As an example of application, we provide data derived from the publication DNA methylation at enhancers identifies distinct breast cancer lineages, Fleischer, Tekpli, et al, Nature Communications, 2017. The genomic regions of interest correspond to 200bp-long regions around CpGs from cluster 2A described in the publication. These regions around CpGs of interest are shown to be associated with FOXA1, GATA, and ESR1 binding. We applied the following command to compute TFBS enrichment using all the CpG probes from the Illumina Infinium HumanMethylation450 microarray:
bash bin/JASPAR_enrich.sh oneSetBg data/LOLA_dbs/ data/example_Fleischer_et_al/clusterA_200bp_hg38.bed data/example_Fleischer_et_al/450k_probes_hg38_200bp.bed JASPAR_enrichment
We observe a clear enrichment for TFBSs associated with the expected TFs. The corresponding swarm plot is:
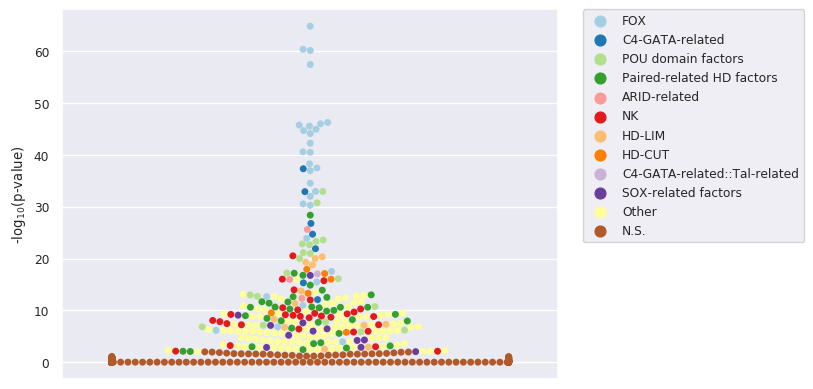
A complementary beeswarm plot allows to clearly visualize the 10 most enriched TFs:
The enrichment and ranking of all the datasets can be visualized in the ranking plot: