JASPAR Documentation
Last updated: 15 Sep. 2021
JASPAR is a regularly maintained open-access database storing manually curated TF binding preferences as position frequency matrices (PFMs). PFMs summarize occurrences of each nucleotide at each position in a set of observed TF-DNA interactions. PFMs can be transformed to probabilistic models to construct position weight matrices (PWMs) or position-specific scoring matrices (PSSMs), which then can be used to scan any DNA sequence and predict transcription factors binding sites (TFBSs). JASPAR database is also providing TFBSs predicted using profiles in the CORE collection.
The motifs in JASPAR are collected in two ways (Figure 1):
- Internally: de novo generated motifs, by analyzing ChIP-seq/-exo sequences using a custom motif discovery pipeline (check the code at our repository).
- Externally: motifs taken directly from other publications and/or resources.
In both cases, the selected motifs are manually curated, that is, our curators found an orthogonal publication giving support to the motif, (e.g., A motif found in ChIP-seq peaks looks similar to one found by SELEX-seq). The Pubmed ID associated with the orthogonal support is provided in the TF profile metadata (Figure 1).
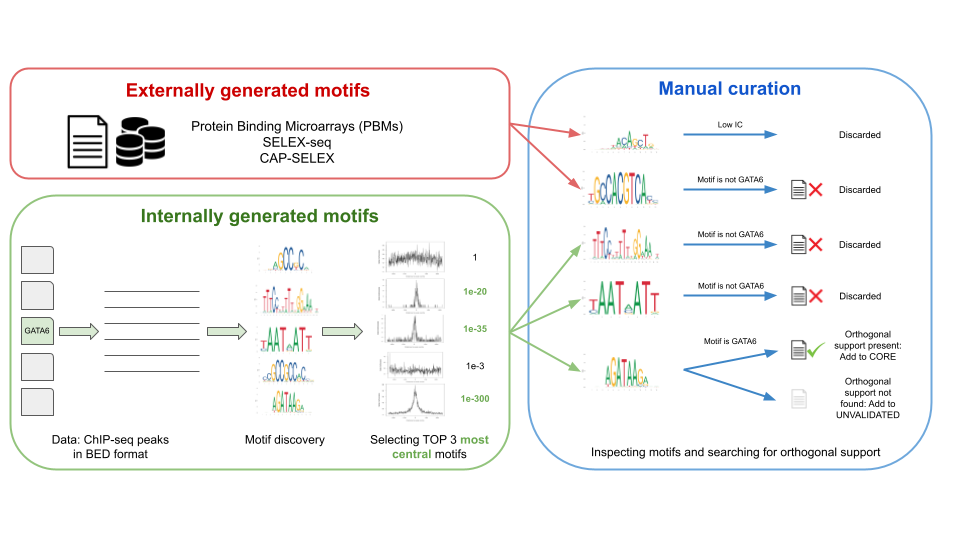
Figure 1. The workflow of data processing and motif curation for the JASPAR database. Motifs in JASPAR database are of two types: externally and internally generated motifs. Both types of motifs are then passed to manual curation step where motifs are manually inspected by a team of curators and orthogonal support in the literature is checked.
JASPAR is the only database with this scope where the data can be used with no restrictions (open source). For a comprehensive review of models and how they can be used, please see the following reviews:
- Modeling the specificity of protein-DNA interactions Quant Biol. 2013 Jun;1(2):115-130
- Applied bioinformatics for the identification of regulatory elements Nat Rev Genet. 2004 Apr;5(4):276-87
JASPAR Collections
The JASPAR database consists of smaller subsets of profiles known as collections. Each of these collections have different goals as described below. The main collection is known as JASPAR CORE and is the collection most scientists use.
JASPAR CORE
The JASPAR CORE collection contains a curated, non-redundant set of TF binding profiles. All profiles are derived from published collections of experimentally defined TF binding motifs for multicellular eukaryotes. The TF binding profiles were historically determined from SELEX experiments or the collection of data from the experimentally determined binding regions of actual regulatory regions. More recent profiles are derived from high-throughput techniques such as ChIP-seq/-exo, Protein Binding Microarray, DAP-seq, or High-Throughput SELEX. One of the central goals of the JASPAR CORE is to provide a single, “best” model for each TF. This means that the database is non-redundant in the sense that there are not many models for the same factor. There are some exceptions motivated by the recognition of significantly different motifs, where in such cases the different profiles are considered as variants. See for example CTCF motifs in JASPAR vertebrates for 3 different binding variants.
JASPAR CORE is what most scientists mean when referring to JASPAR in their manuscripts. For convenience, JASPAR CORE is divided by larger groups of taxons. At the moment there are profiles for six taxonomic groups: vertebrates, plants, fungi, insects, urochordata and nematodes. This distinction is mainly used in the web interface and, optionally, in the download section.
When should it be used? This is the main JASPAR collection and should be used when curated, non-redundant binding profile models for specific factors derived from experimental data are required. TF binding motifs may be used either to predict TFBSs on DNA sequences or as reference when annotating/comparing de novo motifs.
JASPAR CNE
Highly conserved non-coding elements are a distinctive feature of metazoan genomes. Many of them can be shown to act as long-range enhancers that drive expression of genes that are themselves regulators of core aspects of metazoan development and differentiation. Since they act as regulatory inputs, attempts at deciphering the regulatory content of these elements have started. JASPAR CNE is a collection of 233 matrix profiles derived by Xie et al based on clustering of overrepresented motifs from human conserved non-coding elements. While the biochemical and biological role of most of these patterns is still unknown, Xie et al. have shown that the most abundant ones correspond to known DNA-binding proteins, most notably insulator-binding protein CTCF. These matrix profiles will be useful for further characterization of regulatory inputs in long-range developmental gene regulation in vertebrates.
What data does each entry hold?
| Entry | Note |
|---|---|
| Name | The name of model. |
| Matrix ID | a unique identifier for each model. NCRNA matrices always have CNnnnn IDs. |
| Consensus sequence | the consensus sequence of the motif - important as it is the basis for clustering over-represented sites in this study. |
| Validation | The source article (always Xie et al). |
When should it be used?
When analyzing properties of potential enhancers.
JASPAR FAM
The JASPAR FAM database consists of 11 models describing shared binding properties of structural classes of transcription factors. These types of models can be called “familial profiles”, “consensus matrices” or metamodels. The models have two prime benefits:
- Since many factors have similar target sequences, we often experience multiple predictions at the same locations that correspond to the same site. This type of models reduce the complexity of the results.
- The models can be used to classify newly derived profiles (or project what type of structural class its cognate transcription factor belongs to).
The construction of the models is based on the JASPAR CORE collection and described in detail in Sandelin A, Wasserman WW. Constrained binding site diversity within families of transcription factors enhances pattern discovery bioinformatics J Mol Biol. 2004 Apr 23;338(2):207-15.
What data does each entry hold?
| Entry | Note |
|---|---|
| Name | The name of model. In this database, models were built by first partitioning JASPAR CORE matrices into structural classes – therefore, the names are essentially structure class names. |
| Matrix ID | A unique identifier for each model. FAM matrices always have MFnnnn IDs. |
| Class | Structural class of the transcription factor, based on the TFClass system. |
| Data Type | Always METAMODEL |
| Validation | The source article (always J Mol Biol. 2004 Apr 23;338(2):207-15). |
| Included models | The JASPAR CORE matrices used to construct the model |
When should it be used?
When searching large genomic sequences with no prior knowledge. For classification of new user-supplied profiles.
JASPAR PBM
All the PBM collections are built by using new in-vitro techniques, based on k-mer microarrays. PBM matrix models have their own database which is specialized for the data: UniPROBE.
The PBM, collection is the set derived by Badis et al from binding preferences of 104 mouse transcription factors. One profile (IRC900814) was excluded because the transcription factor could not be identified.
What data does each entry hold?
| Entry | Note |
|---|---|
| Name | The name of model. |
| Matrix ID | a unique identifier for each model. SPLICE matrices always have PHnnnn IDs. |
| Class | Structural class of the transcription factor, based on the TFClass system. |
| Family | Structural sub-class of the transcription factor, based on the TFClass system. |
| Species | The species source for the sequences, in Latin. Linked to the NCBI Taxonomic browser. The actual database entries are the NCBI tax IDs – the latin conversion is only in the web interface. |
| Taxon | Group of species, currently consisting of 6 larger groups: vertebrate, nematode, insect, plant, fungi, chordate. |
| Validation | A link to PubMed indicating the relevant publication reporting the sites used in the model building. |
| Data Type | Methodology used for matrix construction. |
| Comment | For some matrices, a curator comment is added. |
When should it be used?
Where it is important that each matrix was derived using the same protocol.
JASPAR PBM HLH
All the PBM collections are built by using new in-vitro techniques, based on k-mer microarrays. PBM matrix models have their own database which is specialized for the data: UniPROBE.
The PBM HLH, collection is the set derived by Grove et al. It holds 19 C. elegans bHLH transcription factor models.
What data does each entry hold?
| Entry | Note |
|---|---|
| Name | The name of model. |
| Matrix ID | a unique identifier for each model. SPLICE matrices always have PHnnnn IDs. |
| Class | Structural class of the transcription factor, based on the TFClass system. |
| Family | Structural sub-class of the transcription factor, based on the TFClass system. |
| Species | The species source for the sequences, in Latin. Linked to the NCBI Taxonomic browser. The actual database entries are the NCBI tax IDs – the latin conversion is only in the web interface. |
| Taxon | Group of species, currently consisting of 6 larger groups: vertebrate, nematode, insect, plant, fungi, chordate. |
| Validation | A link to PubMed indicating the relevant publication reporting the sites used in the model building. |
| Data Type | Methodology used for matrix construction. |
| Comment | For some matrices, a curator comment is added. |
When should it be used?
Where it is important that each matrix was derived using the same protocol, focused on bHLH factors.
JASPAR PBM HOMEO
All the PBM collections are built by using new in-vitro techniques, based on k-mer microarrays. PBM matrix models have their own database which is specialized for the data: UniPROBE.
The PBM, collection is the set derived by Berger et al including 176 profiles from mouse homeodomains.
What data does each entry hold?
| Entry | Note |
|---|---|
| Name | The name of model. |
| Matrix ID | a unique identifier for each model. SPLICE matrices always have PHnnnn IDs. |
| Class | Structural class of the transcription factor, based on the TFClass system. |
| Family | Structural sub-class of the transcription factor, based on the TFClass system. |
| Species | The species source for the sequences, in Latin. Linked to the NCBI Taxonomic browser. The actual database entries are the NCBI tax IDs – the latin conversion is only in the web interface. |
| Taxon | Group of species, currently consisting of 6 larger groups: vertebrate, nematode, insect, plant, fungi, chordate. |
| Validation | A link to PubMed indicating the relevant publication reporting the sites used in the model building. |
| Data Type | Methodology used for matrix construction. |
| Comment | For some matrices, a curator comment is added. |
When should it be used?
Where it is important that each matrix was derived using the same protocol, focused on homeobox factors.
JASPAR PHYLOFACTS
The JASPAR PHYLOFACTS database consists of 174 profiles that were extracted from phylogenetically conserved gene upstream elements.
For a detailed description, see Xie et al., Systematic discovery of regulatory motifs in human promoters and 3’ UTRs by comparison of several mammals., Nature 434, 338-345 (2005) and supplementary material.
In short, the authors used the following strategy. Promoters (defined as the 4-kb region around the TSS) of human genes from the RefSeq database were aligned against the genomes of mouse, rat and dog. Every consensus sequence of length between 6 and 26, defined over an alphabet of 4 unique (A,C,G,T) and 7 degenerate (R, Y, K, M, S, W, N) nucleotides, was scanned over the alignments. A motif is regarded as conserved when it appears in the alignment both for the human and for the other three mammalian species. The conservation rate p is defined as the number of times a motif is conserved divided by the number of times it occurs in man only. This conservation rate is compared to the expected conservation rate p0, estimated from random motifs, which gives the motif conservation score MCS. Only motifs with an MCS>6 were retained, resulting in a list of 174 highly conserved motifs (see supplementary Table S2 of Xie et al.). The count matrices for these 174 motifs were extracted from the downloaded alignments. They were further annotated according to their resemblance with TRANSFAC and JASPAR CORE motifs. For TRANSFAC, the annotation of Xie et al. was used. For comparing to the JASPAR CORE matrices, the Pearson Correlation Coefficient (PCC) was used to define matrix similarity. All PHYLOFACTS matrices were scanned against the JASPAR CORE matrices, and matrices were regarded as being similar when PCC>0.8. When multiple hits were found, only the one with the highest PCC was retained.
What data does each entry hold?
| Entry | Note |
|---|---|
| Name | The name of model. In this database, models are based on over-represented words which are unique. The name is simply the consensus sequence. |
| Matrix ID | a unique identifier for each model. PHYLOFACTS matrices always have PFnnnn IDs. |
| Jaspar | The JASPAR CORE motif that has the best similarity score when compared to this model. Only hits with a similarity score over 0.8 are considered. |
| Transfac | The transfac (public version) motif that has the best similarity score when compared to this model. Only hits with a similarity score over 0.8 are considered. |
| Taxon | Group of species. Always
vertebrates. |
| Data Type | Always phylogenetic. |
| Validation | The source article (always Nature 434, 338-345 (2005)). |
When should it be used?
The JASPAR PHYLOFACTS matrices are a mix of motifs corresponding to motifs for known and undefined transcription factors. They are useful when one expects that other factors might determine promoter characteristics, such as structural aspects and tissue specificity. They are highly complementary to the JASPAR CORE matrices, so are best used in combination with this matrix set.
JASPAR POLII
The deluge of novel data presented recently pertaining transcription start sites (reviewed in (13,14)) motivates computational studies of core promoters. The JASPAR_POLII sub-database holds known 13 DNA patterns linked to RNA polymerase II core promoters, such as the Inr and BRE elements, each based on experimental evidence: each model must be constructed using 5 or more experimentally verified sites. An important difference to the transcription factor profiles in JASPAR CORE is that patters here do not necessarily have a specified protein interactor (See (15) for a review on core promoter patterns). When possible, profiles were extended by two nucleotides more than the core motif. We consistently report positions relative to the TSS as the position of 5’ and 3’ edge of the matrix.
What data does each entry hold?
| Entry | Note |
|---|---|
| Name | The reported name of the pattern (not necessarily the binding protein, if this is known). |
| Matrix ID | a unique identifier for each model. POLII matrices always have POLnnn IDs. |
| Species | The species source for the sequences, in Latin. “-“ generally signifies that several species were used in the model construction. |
| Validation | A link to PubMed indicating the relevant publication reporting the sites used in the model building. |
| Start relative to TSS | Reported bias (if any) on position relative to the dominant transcription start site in the promoter. This is counted from the 5’ end of the pattern (the left side). As we have added some flanking nucleotides, this sometimes is not the exact numbers shown in the source publications. |
| End relative to TSS | See above. Distance is counted from the 3’ end of the matrix (the right side). |
When should it be used?
When analyzing properties of core promoters.
JASPAR SPLICE
This small collection contains matrix profiles of human canonical and non-canonical splice sites, as matching donor:acceptor pairs. It currently contains only 6 highly reliable profiles obtained from human genome made by Chong et al. In the future, we shall include additional eukaryotic species, as well as new models for exonic splicing enhancers (ESE) and inhibitors (ESI).
What data does each entry hold?
| Entry | Note |
|---|---|
| Name | The name of model. |
| Matrix ID | a unique identifier for each model. SPLICE matrices always have SPnnnn IDs. |
| Validation | The source article (always Chong et al). |
When should it be used?
When analyzing splice sites and alternative splicing
JASPAR UNVALIDATED
The JASPAR UNVALIDATED collection was introduced in the 2020 release of the database. These profiles can be browsed separately in the JASPAR database and they can be distinguished by an identifier that starts with “UN” (Figure 2A,B). These profiles are regarded as unvalidated because our curators could not find any orthogonal support from the existing literature. However, the profiles in this collection are high-quality, such as a profile that has high IC and good centrality (see Figure 2C).
We encourage the community to engage in the curation of these profiles by performing experiments and/or pointing us to literature that our curators missed in order to support these profiles. Suggestions for validation can be submitted via the form provided on the profiles page (see Figure 2D).
When should it be used? These profiles are not non-validated so we recommend using them with caution.
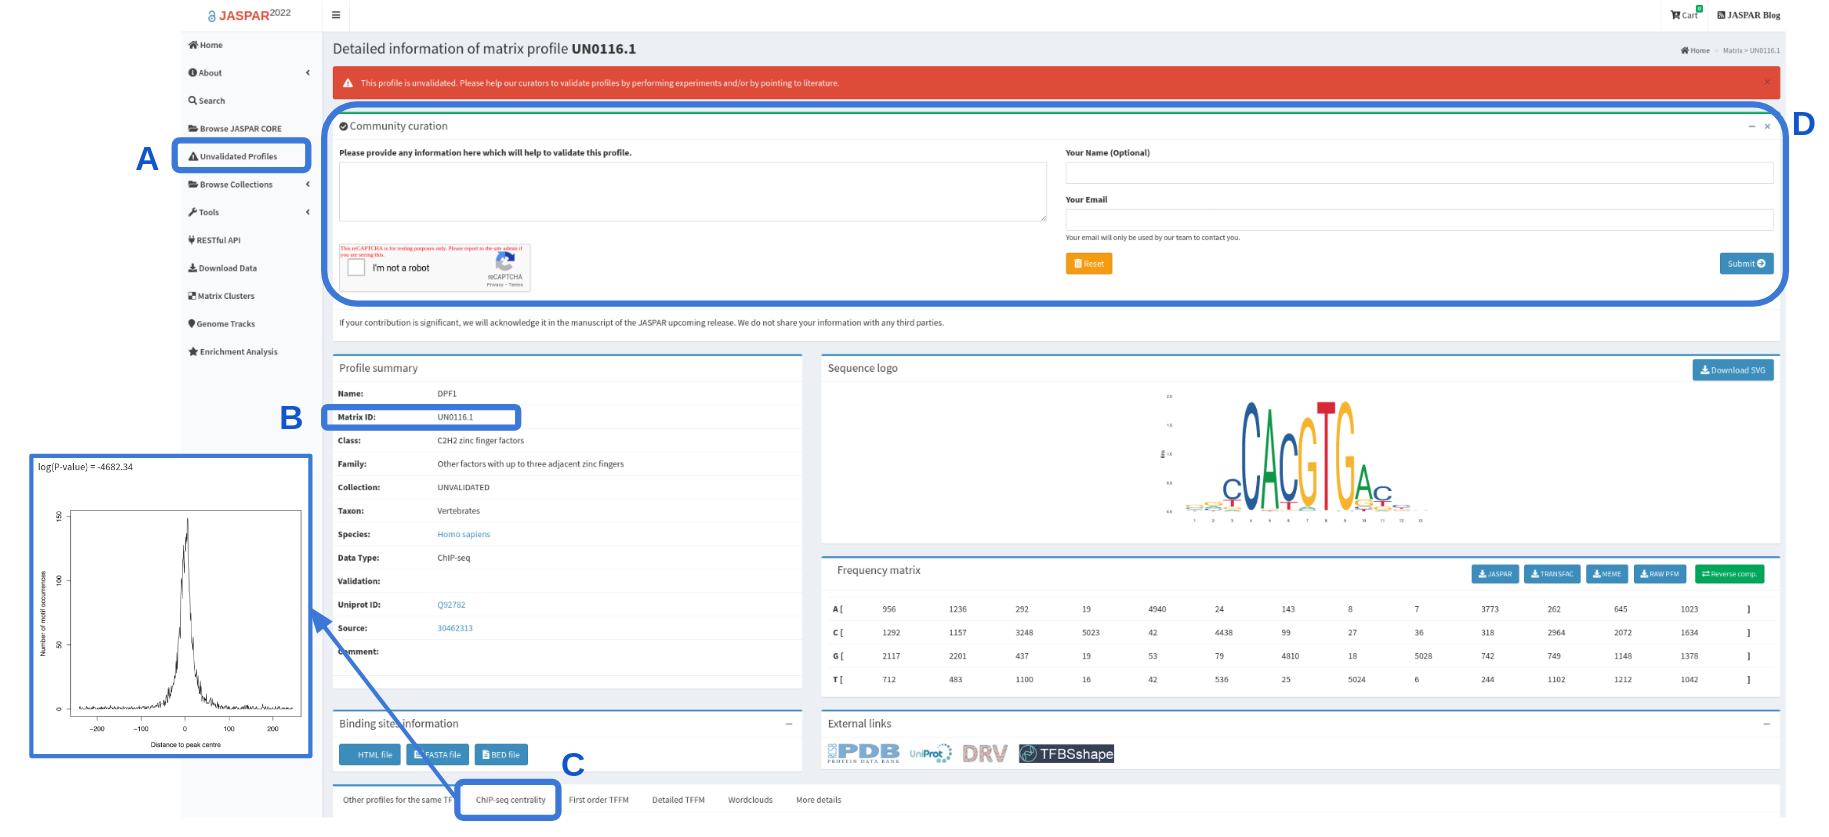
Figure 2. Screengrab of the DPF1 profile (UN0116.1). The highlighted sections indicate where to browse UNVALIDATED collection (A) in which the profiles have identifiers always starting with “UN” (B). These profiles do not yet have orthogonal support, but are of high quality, e.g. high IC and good centrality (C). Scientific community is invited to participate in curation of the UNVALIDATED collection by submitting their suggestions for the validation (D).
JASPAR Metadata
Each profile when displayed in the website provides all kinds of information. First of all, the metadata describing the profile (see Table 1 and Figure 3). Then, the matrix and motif logo are displayed. At the bottom of the page there is also information available on all versions of the profiles (see Figure 3).
| # | Entry | Note |
|---|---|---|
| 1 | Name | The name of the TF. As far as possible, the name is based on the standardized Entrez gene symbols. In the case the model describes a TF hetero-dimer, two names are concatenated, such as Pou5f1::Sox2. In a few cases, one particular TF may have different splice forms resulting in different binding specificity, in previous releases these cases were handled as binding variants (e.g., CEBPG (MA0838.1) and CEBPG(var.2) (MA1636.1)). From the JASPAR 2022 release, binding variants are not anymore indicated as part of the TF name: all binding variants for the same TF share the TF name, but each one has a different Matrix ID. |
| 2 | Matrix ID | A unique identifier for each model. CORE matrices always have identifiers starting with “MA”, while profiles in the UNVALIDATED collection have identifiers starting with “UN”. The number after the dot (e.g., MA1636.1) corresponds to the version. Larger number indicates that a motif has been updated. |
| 3 | Class | Structural class of the transcription factor, based on the TFClass system. |
| 4 | Family | Structural sub-class of the transcription factor, based on the TFClass system. |
| 5 | Collection | Indicating which collection the profile belongs: CORE or UNVALIDATED. |
| 6 | Taxon | Group of species, currently consisting of 6 larger groups: vertebrate, plants, fungi, insects, urochordata and nematodes. |
| 7 | Species | The species source for the sequences, in Latin. Linked to the NCBI Taxonomic browser. The actual database entries are the NCBI tax IDs – the latin conversion is only in the web interface. |
| 8 | Data type | Methodology used for matrix construction, e.g., ChIP-seq, PBM, SELEX. |
| 9 | Validation | A link to PubMed indicating the orthogonal evidence of the Tf binding profile. |
| 10 | Uniprot ID | A link to the corresponding UniProt record. |
| 11 | Source | A reference to the data, which was used to build a profile and where the profile was taken from. |
| 12 | Comment | For some matrices, a curator comment is added. |
Table 1. The metadata categories that are displayed in a profile page. Each category of the metadata has a number assigned and is also shown in Figure 3.
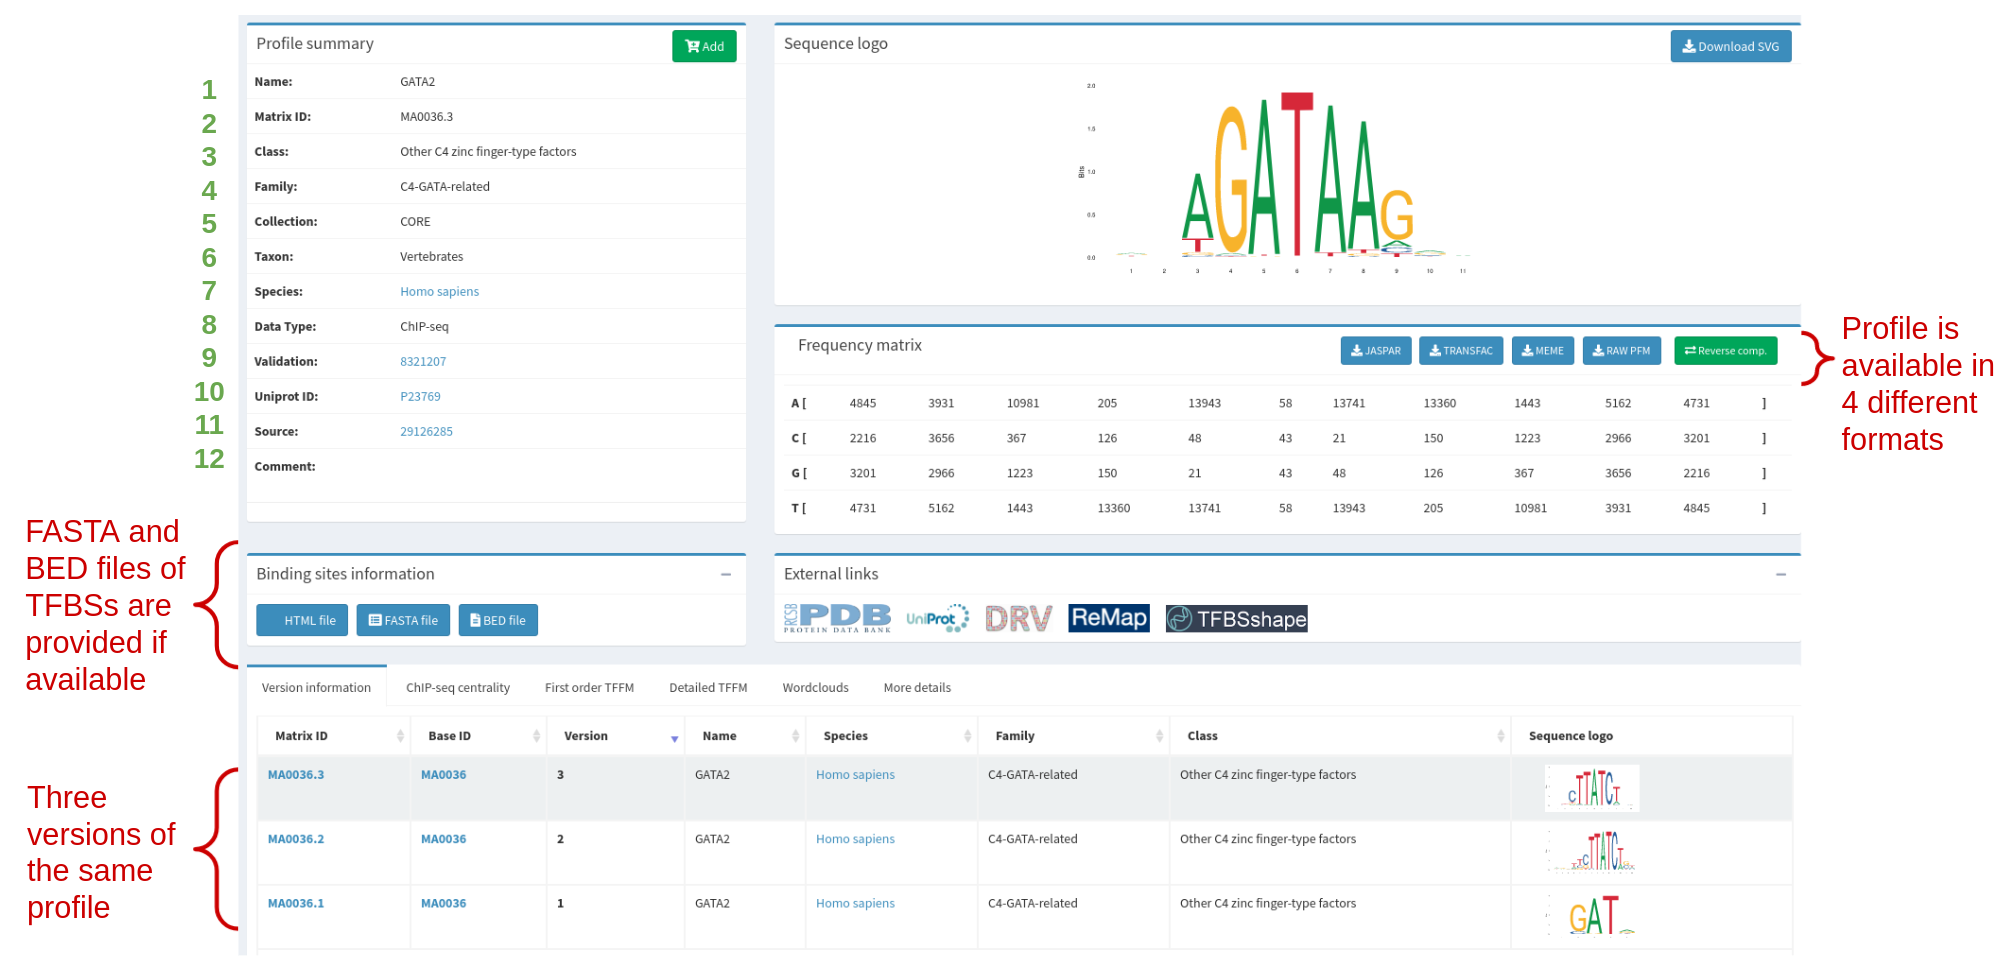
Figure 3. GATA2 profile in JASPAR (MA0036.3), highlighting the metadata and other information available. Metadata categories (green numbers) are explained in more detail in Table 1.
JASPAR Matrix formats
JASPAR stores transcription factor binding profiles in four formats. Following is more information on formats and the DNA binding profile for GATA6 transcription factor (JASPAR ID MA1104.2) as an example:
Raw PFM
Each matrix is separated by a FASTA-like header starting with the > symbol and then a matrix ID. The count for each base (ACGT) is specified on its own space separated line where each element corresponds to one column. The order of the lines for the bases is A, C, G and finally T.
>MA1104.2 GATA6
22320 20858 35360  5912 4535  2560  5044 76686  1507  1096 13149 18911 22172
16229 14161 13347 11831 62936 1439  1393   815   852 75930  3228 19054 17969
13432 11894 10394  7066 6459   580   615   819   456   712  1810 18153 11605
27463 32531 20343 54635 5514 74865 72392  1124 76629  1706 61257 23326 27698
JASPAR
This is similar to the raw format, having an identical header. The lines for each base however start with a label for the nucleotide (A, C, G or T) and then the columns follow enclosed in brackets: [].
>MA1104.2 GATA6
A  [ 22320  20858  35360   5912   4535   2560   5044  76686   1507   1096  13149  18911  22172 ]
C  [ 16229  14161  13347  11831  62936   1439   1393    815    852  75930   3228  19054  17969 ]
G  [ 13432  11894  10394   7066   6459    580    615    819    456    712   1810  18153  11605 ]
T [ 27463 32531 20343 54635 5514 74865 72392 1124 76629 1706 61257 23326 27698 ]TRANSFAC
This is a TRANSFAC-like format having a few lines with information, such as “AC”, which stores JASPAR matrix unique ID, “ID” indicates the TF name and “DE” has both. The data itself is transposed as compared to the other formats, meaning that each line corresponds to a column in the profile. The column lines start with a number denoting the column index (counting from 0). Additional lines starting with “CC” store some additional metadata, such as TF family and class. A final line of the matrix file is indicated with “//”. Empty lines are indicated with “XX”.
AC MA1104.2
XX
ID GATA6
XX
DE MA1104.2 GATA6 ; From JASPAR
PO	A	C	G	T
01	22320.0	16229.0	13432.0	27463.0
02	20858.0	14161.0	11894.0	32531.0
03	35360.0	13347.0	10394.0	20343.0
04	 5912.0	11831.0	 7066.0	54635.0
05	 4535.0	62936.0	 6459.0	 5514.0
06	 2560.0	 1439.0	  580.0	74865.0
07	 5044.0	 1393.0	  615.0	72392.0
08	76686.0	  815.0	  819.0	 1124.0
09	 1507.0	  852.0	  456.0	76629.0
10	 1096.0	75930.0	  712.0	 1706.0
11	13149.0	 3228.0	 1810.0	61257.0
12	18911.0	19054.0	18153.0	23326.0
13	22172.0	17969.0	11605.0	27698.0
XX
CC tax_group:vertebrates
CC tf_family:GATA-type zinc fingers
CC tf_class:Other C4 zinc finger-type factors
CC pubmed_ids:9915795
CC uniprot_ids:Q92908
CC data_type:ChIP-seq
XX
//MEME
MEME motif format is a simple text format for motifs that is accepted by the programs in the MEME Suite that require MEME Motif Format. A text file in MEME minimal motif format can contain more than one motif, and also (optionally) specifies the motif alphabet, background frequencies of the letters in the alphabet, and strand information (for motifs of complementable alphabets like DNA), as illustrated in the example below:
MEME version 4

ALPHABET= ACGT

strands: + -

Background letter frequencies
A 0.25 C 0.25 G 0.25 T 0.25

MOTIF MA1104.2 GATA6
letter-probability matrix: alength= 4 w= 13 nsites= 79444 E= 0
0.280953  0.204282  0.169075  0.345690
0.262550  0.178251  0.149716  0.409483
0.445093  0.168005  0.130834  0.256067
0.074417  0.148923  0.088943  0.687717
0.057084  0.792206  0.081303  0.069407
0.032224  0.018113  0.007301  0.942362
0.063491  0.017534  0.007741  0.911233
0.965284  0.010259  0.010309  0.014148
0.018969  0.010725  0.005740  0.964566
0.013796  0.955768  0.008962  0.021474
0.165513  0.040632  0.022783  0.771071
0.238042  0.239842  0.228501  0.293616
0.279090  0.226184  0.146078  0.348648
URL https://jaspar2020.genereg.net/matrix/MA1104.2
Version control
Since the 4th release of JASPAR, all matrix models have versions. This is primarily to keep track of improvements - which can be anything from correcting typos to actually making a new model based on new data. Version control works as follows: IDs are based on a stable ID, and a version number, so that the whole ID is [stable ID].[version]. The stable ID follows a certain TF, or other logic unit such as a dimer pair. For instance, the stable ID for the factor GATA2 is MA0036.3. However, the GATA2 matrix has been updated two times with new data, so there are currently four versions: MA0036.1, MA0036.2, and MA0036.3 (See Figure 3).
The latest versions of all profiles with orthogonal support are referred to as JASPAR CORE non-redundant collection (latest versions of profiles without orthogonal support are stored in JASPAR UNVALIDATED non-redundant). All versions of profiles are also available in the database and referred to as redundant collection (CORE and UNVALIDATED).
Accessing and Downloading JASPAR Data
Depending on what user wants to download there are several ways to access and download JASPAR data. TF binding profiles can be downloaded in bulk from the website (all together or per taxon), metadata can be retrieved using JASPAR RESTful API or accessed through pyJASPAR. Profiles can also be accessed through the R/Bioconductor package.
JASPAR downloads
JASPAR collections in bulk are generally downloadable in three different forms from the JASPAR downloads page (Figure 4):
- Flat files in JASPAR, MEME and TRANSFAC formats for CORE redundant and non-redundant collections of matrix profiles. CORE collection is available to download for each specific taxonomic group (Figure 4B,H).
- Archives of files (also in JASPAR, MEME and TRANSFAC formats for CORE and UNVALIDATED) each providing individual matrix profile information (Figure 4D).
- A database/SQL dump of the data and metadata (Figure 4F).
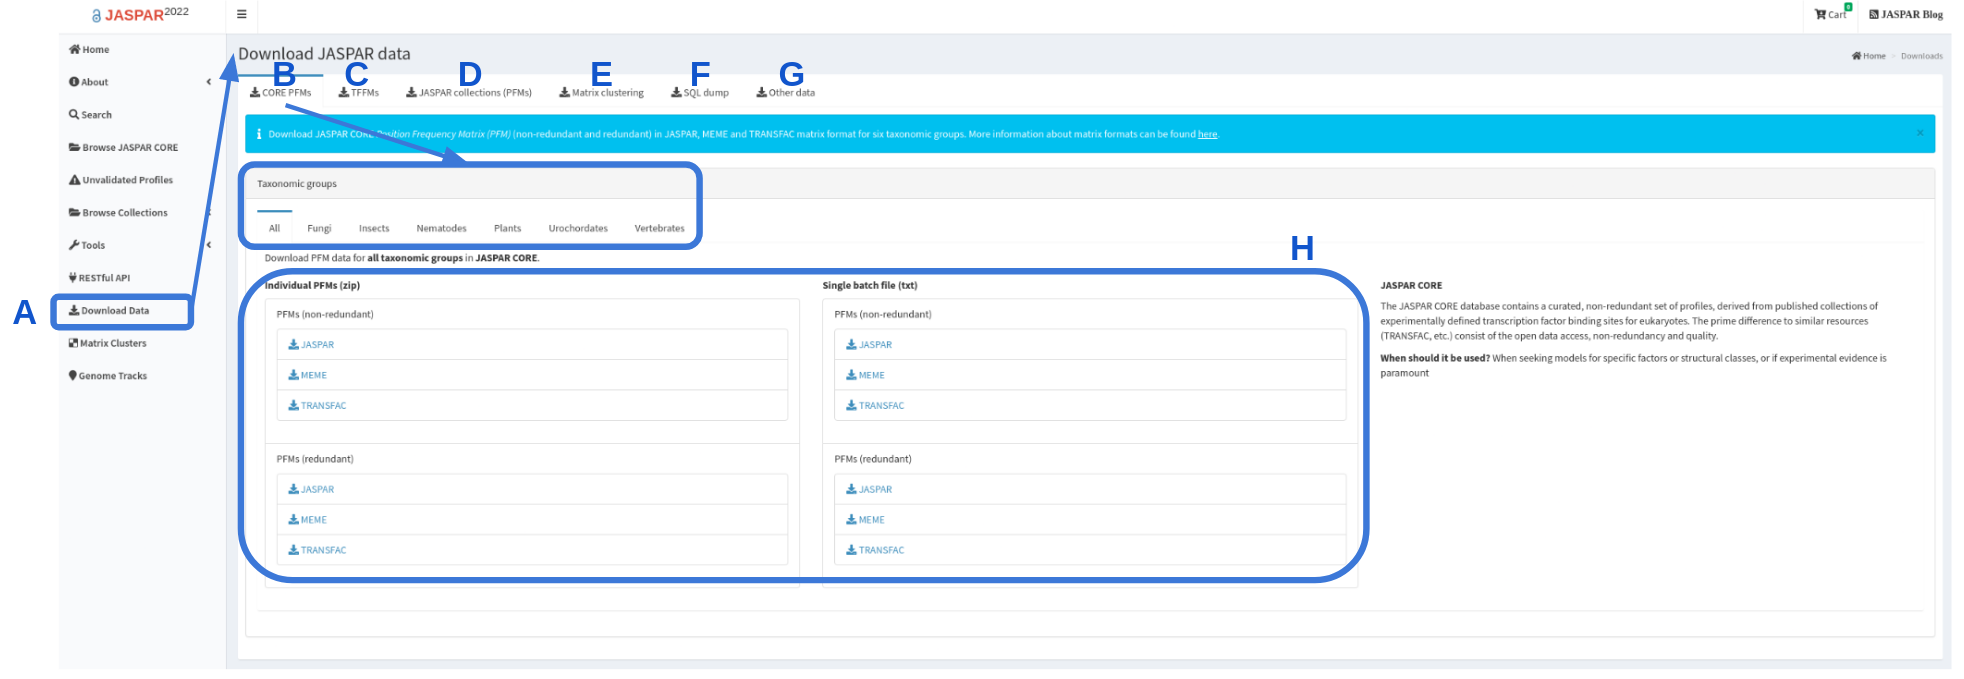
Figure 4. Screen grab of JASPAR Download page. Download page is accessible through the left panel (A). By default “CORE PFMs” download page is displayed (B), where a user can find all CORE PFMs or for each of the taxonomic groups for download as individual files or a single file (H). The UNVALIDATED collection can be downloaded from “JASPAR collections (PFMs) (D). Other data, such as TFFMs, matrix clustering or the entire SQL dump can also be downloaded (C, E, F). TFBSs and matrix clustering are available under “Other data” (G).
Other sources and analysis results data files are also available:
- Transcription Factor Flexible Models (TFFMs) are available to download as tar files. In addition additional information regarding TFFMs is available as a .csv file (Figure 4C).
- Matrix clustering of CORE and CORE + UNVALIDATED results are available to download as radial trees or as clustering summaries for each of the taxonomic groups (Figure 4G).
- Other data, such as sequences used to generate PFMs in FASTA format, genomic coordinates of the sequences in BED format, motif logos and centrality plots are available as bulk download under “Other data” (Figure 4G).
JASPAR RESTful API
Since 2020 JASPAR has a Representational State Transfer (REST) application programming interface (API) to query/retrieve matrix profile data from JASPAR database. It is a browsable API and comes with a human browsable interface and also programmatic interface, which return the results in JSON format. For more details, please read the API documentation. If you wish to cite the JASPAR REST API, please check the FAQ page.
pyJASPAR
pyJASPAR is a Pythonic interface to access JASPAR transcription factor profiles. It uses Biopython and SQLite3 to provide a serverless interface to JASPAR database to query and access TF motifs across current and previous releases of the database. Currently these releases are available in pyJASPAR: JASPAR2014, JASPAR2016, JASPAR2018, JASPAR2020, and JASPAR2022. Information on installation of pyJASPAR can be found under Tools, in the pyJASPAR repository and documentation.
R Bioconductor Package
Different releases of JASPAR can also be accessed through Bioconductor data packages. Currently four JASPAR releases are available:
To browse the database TFBSTools package is required. You can find more information about this package and installation under Tools and here.
Browsing JASPAR motif clusters
Since JASPAR 2018 (7th release) we have introduced a visual representation of all motifs (CORE collection and CORE + UNVALIDATED collections) as a hierarchical tree displaying a global motif alignment (Figure 5). Clusters are accessible by clicking on the “Matrix Clusters” button at the left menu on the JASPAR website (Figure 5A). For each taxon, separately, all motifs are clustered and aligned using the RSAT matrix-clustering tool, these radial trees can be zoomed and explored more closely.
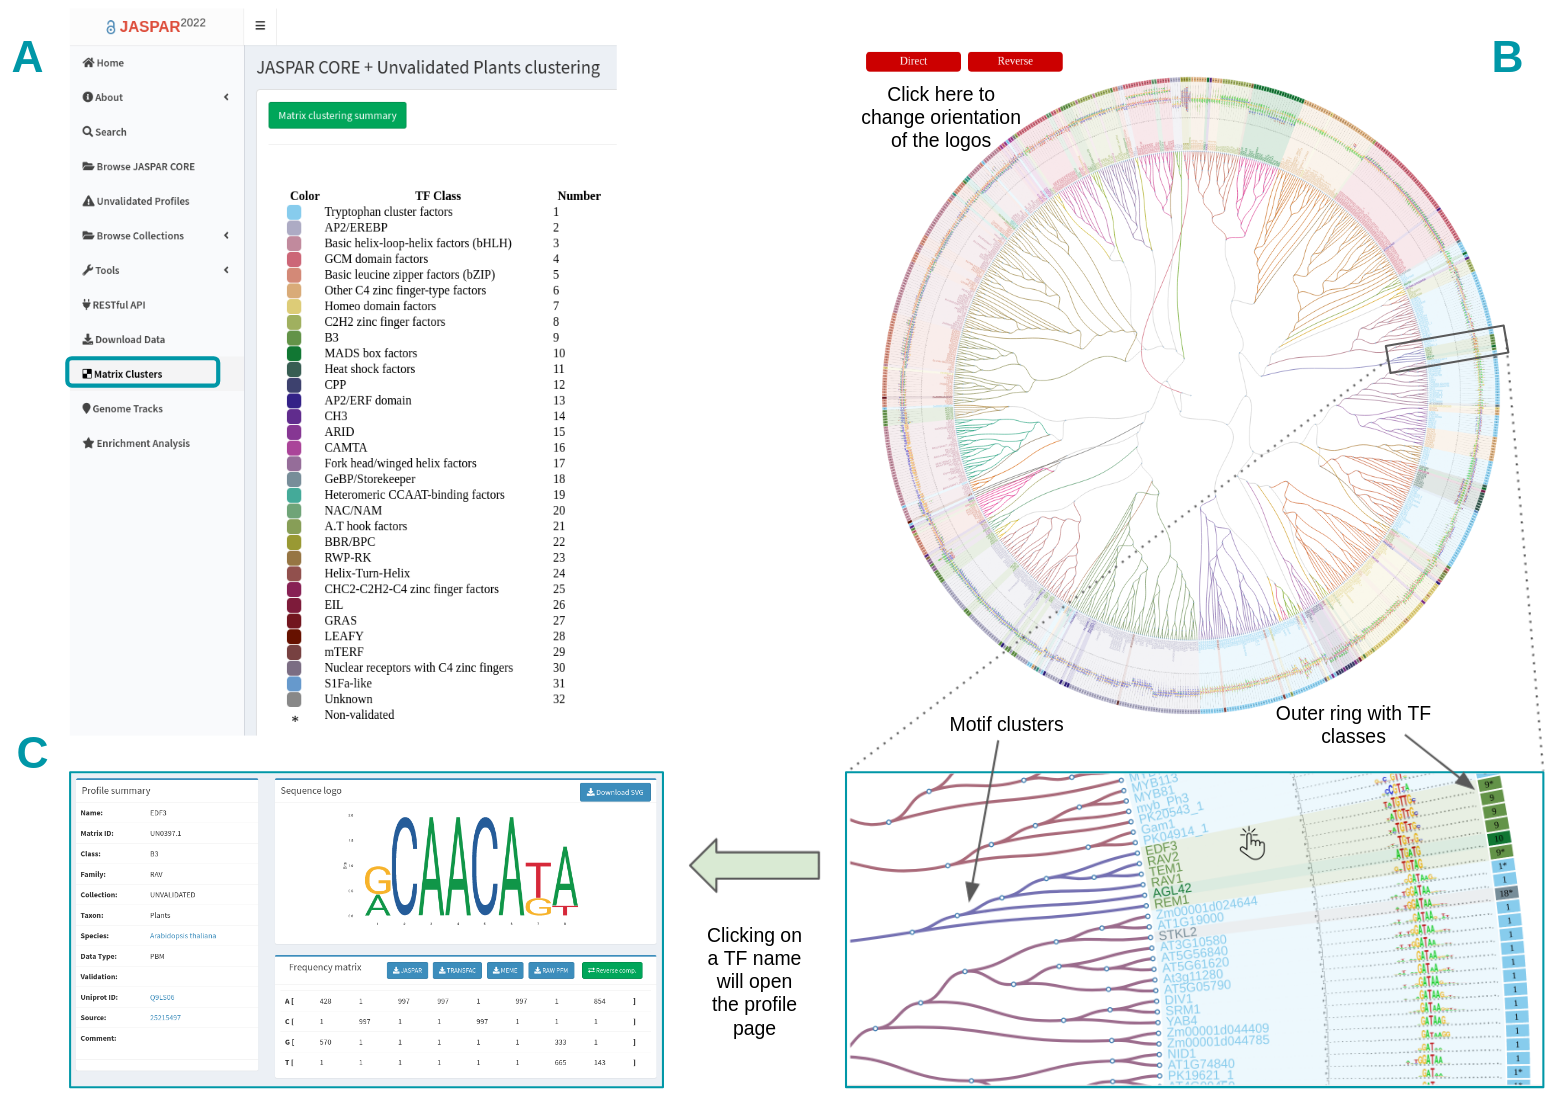
Figure 5. Browsing matrix clustering in JASPAR. All motifs corresponding to a taxonomic group are displayed as a hierarchical tree with a global alignment. A) The TF class information is displayed as an outer ring. B) Users can change motif logo orientation and trees can be zoomed in to ease the motif exploration. C) Each TF name in the tree has a link pointing to its corresponding profile page on the JASPAR website.
The TF classes obtained from TFclass are displayed in the annotation table, each one with an associated number and a color (Figure 5A). The tree is surrounded by an outer ring containing the TF classes colors and numbers (Figure 5B). The UNVALIDATED motifs are in addition depicted with a star (*) next to their TF class (Figure 5B). Users can change TF logo alignment orientation by clicking on the Direct/Reverse red buttons on top (Figure 5B).
The branch colors correspond to the clusters found by RSAT matrix-clustering, note that although TFs from the same family tend to be grouped in the same cluster, sometimes members of other TF families are grouped together (Figure 5B, see cluster containing TF from classes 9 and 10). The tree leaves correspond to TF names, by clicking on one of them, it will open a tab in your browser with the dedicated profile page (Figure 5D).
JASPAR Software Tools
JASPAR contains not only collections of TF binding profiles, but also comes with a suite of tools, such as TFBS enrichment tool, For further details please check the Tools page.